
CRM
Read your reports and forecast
Premium
What you'll do
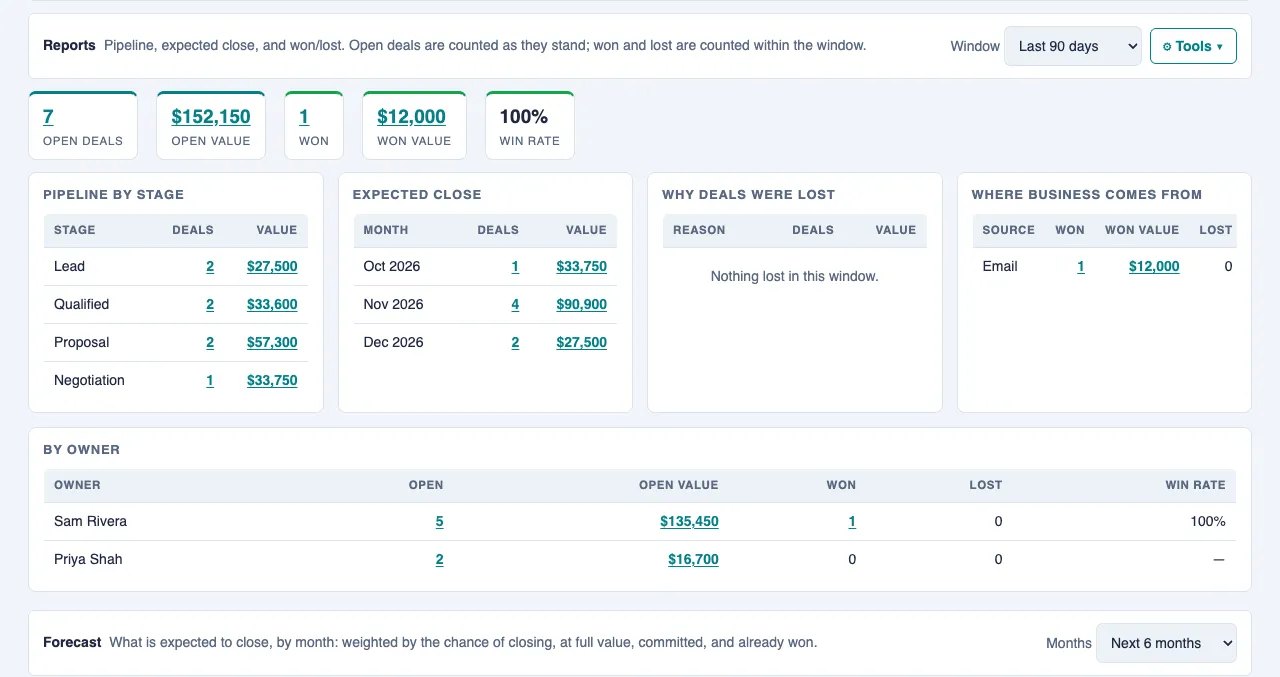
Use the Reports tab to see your pipeline, wins and losses, and what is expected to close each month, then open the deals behind any number.
Steps
Read the report
- Select the Reports tab.
- Choose a Window: Last 30 days, Last 90 days, Last 12 months or All time. Open deals are always counted as they stand. Won and lost deals are counted within the window.
- Read the figures across the top: Open deals, Open value, Won, Won value and Win rate.
- Read the tables below: Pipeline by stage, Expected close, Why deals were lost, Where business comes from and By owner.
Read the forecast
- Scroll down to Forecast on the same tab.
- Choose how far ahead to look in Months: Next 3 months, Next 6 months or Next 12 months.
- Read each month's row. Forecast is each open deal's value times its chance of closing. Best case is every open deal at full value. Commit is the open deals their owners marked Commit. Already won is what was won that month.
- Check Past due for open deals whose expected close month has passed, and No date set for open deals with no expected close date. Total adds past due and the months shown. No date set is not in the total.
See the deals behind a number
- Select any underlined number in the report or the forecast.
- The Pipeline tab opens with only those deals, and a banner says which deals they are.
- Select Export these to download them as a CSV file, ← Back to report to return, or ✕ Clear to see the whole board again.
Adjust a deal's forecast
- Open the deal.
- Under Forecast, select Commit if you are confident it will close.
- To use your own chance of closing instead of the stage's, type a whole number from 0 to 100 in Chance. Leave it blank to use the stage's chance.
Tips
- An Editor sets each stage's chance of closing under Settings, Forecast, then selects Save. The defaults are Lead 10%, Qualified 25%, Proposal 50% and Negotiation 75%.
- To share the numbers, open Tools on the Reports tab and select Copy summary for a plain-text summary, or Export CSV for a spreadsheet.
- If your organization uses more than one pipeline, the report and the forecast show each pipeline separately.
- If the Reports tab says reports are switched off, an administrator turns on Pipeline reports under Settings, Administration.
- If the forecast says to run the provisioning update to use Commit, ask your administrator. The forecast still works from the stage chances until then.